 MugiPocketNews
Collectors bring stock market instincts to card charts and get burned, because a card market has a few sales a week and a stock has millions. The chart of a One Piece card has to be read differently. These are the four things to check, in the order they matter.
The four checks
- The range, not the line. On a thin market the meaningful number is the band the price has stayed inside for 60 to 90 days. A move inside the band is noise; a move that leaves the band is news.
- The steps. Card prices move in steps, not slopes: a flat month, then a jump when the last cheap copies sell, then another flat month. A chart with three steps up in a year is a strong card. A chart with one spike and a slide is one sale.
- The spike test. If a single point sits far above its neighbours and the next point is back in the band, it was one sale. Do not buy the spike and do not sell the dip after it.
- Volume in the background. A card with hundreds of sales a year has a chart you can trust point by point. A card with ten sales a year has a chart that is a rumor between the points.
On a card chart, the band is the price. The line is just where the band was last measured.

Track your collection value and verify what you buy
Your vault updates with daily prices; Mugi Vision checks a card in seconds.
Open the Vault in the AppFree on iOS and Android
Two charts, side by side
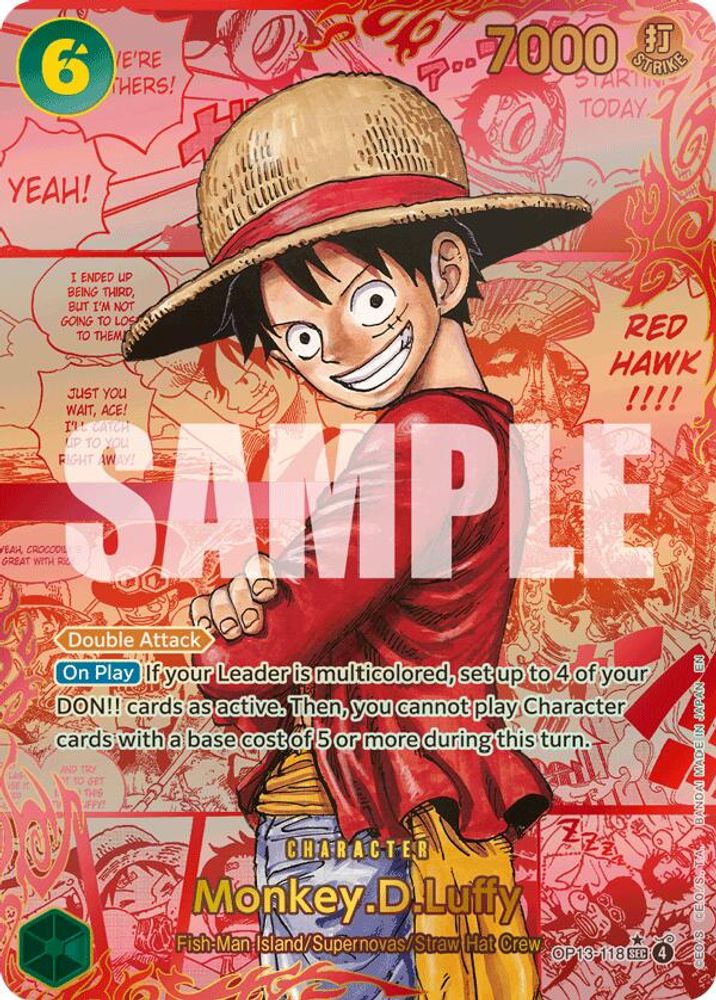
Boa Hancock Manga OP07-051 is a high volume chart: hundreds of sales a year, clear steps, a band you can trade against. Luffy Red Manga OP13-118 is a low volume chart: a few sales a month, a $12,900 spike in July and an $8,900 band since. Both are real prices. Only one of them is a price you can act on this week.
![Boa Hancock [Alternate Art Manga]](/og/c/OP07-051__alternate-art-manga.jpg) Boa Hancock [Alternate Art Manga] · OP07-051
Boa Hancock [Alternate Art Manga] · OP07-051💡 Price analysis PREMIUM VALUATION
Trading near its recent high, the card continues to command a premium valuation. Scarcity supports long term confidence, though upside from current levels may be more measured.
📈 Price history
Market price now$1,497
🏅 Graded value
PSA 10 · Gem Mint$2,459
PSA 9$1,353
🛡 Worth grading? WORTH GRADING
Raw price now$1,497
Grading cost (PSA)- $58
Value if it hits PSA 10$2,459
You could gain+$905
📊 Population PSA · CGC
Total graded142
🛒 Recent sales
PSA 10 · 2026-06-12$2,543
PSA 10 · 2026-07-13$2,543
PSA 10 · 2026-08-14$2,544
The two year chart, the band and the volume, for every cardMugiPocket draws the full history with daily points and shows sales volume beside it. Free to open.
Open the chart in the AppCharts on this site show the last 90 days free; the full history is in the app.